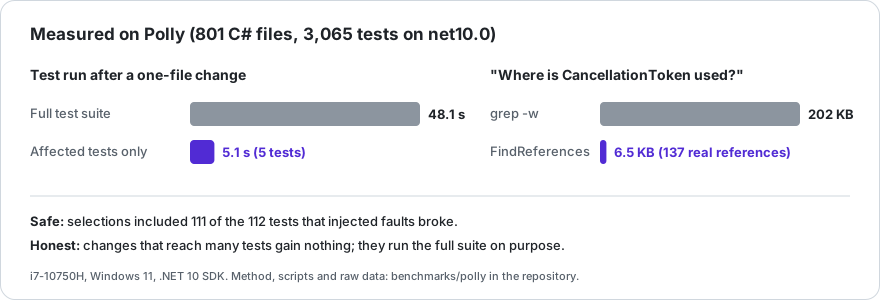
Ask an AI coding agent where ResilienceContext.CancellationToken is used in Polly, and it will usually run grep. Grep returns 1,354 lines, about 202 KB of text, because CancellationToken is also a type, a parameter name and a word in comments. The agent reads all of it, or a truncated slice of it, and guesses.
The compiler knows the answer: 137 references. As a tool response, that's 6.5 KB.
DotNetDevMCP started as a place to try out new ideas: MCP, Roslyn, agents calling compilers. The more I built, the more it looked like something other .NET developers could use, so I turned it into an open-source package. It's an MCP server that gives agents Roslyn's view of a .NET solution: real references, implementations, renames with a compile check, builds with compact output, and a tool that runs only the tests a change can break. This post is mostly about that last tool, because it's the one I got wrong first.
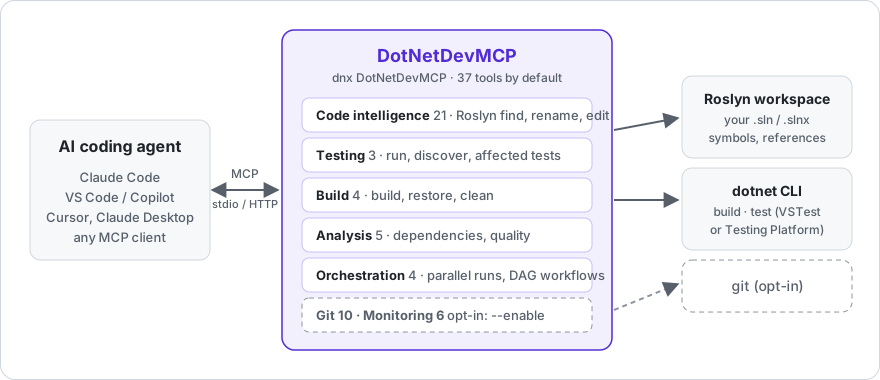
How do I install DotNetDevMCP?
With the .NET 10 SDK:
claude mcp add dotnetdevmcp -- dotnet dnx DotNetDevMCP --yesFor VS Code, nuget.org's package page has an "MCP Server" tab that generates the mcp.json entry. It's also in the MCP Registry as io.github.csa7mdm/dotnetdevmcp.
Then ask your agent: "Load MySolution.sln and tell me where OrderService.Submit is used."
How does dotnet_test_affected pick which tests to run?
After an edit, agents rerun the whole test suite. On a big solution that's minutes per iteration, several times per task.
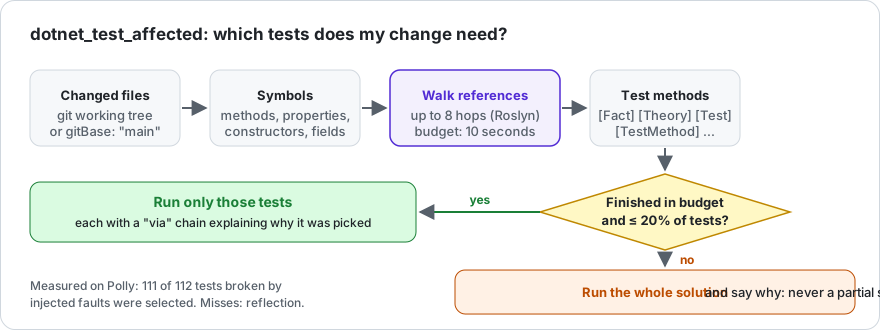
dotnet_test_affected does something narrower. It takes the symbols declared in the changed files, asks Roslyn who references them, then who references those, until it reaches methods marked [Fact], [Theory], [Test] or [TestMethod]. Then it runs exactly those tests. Every selected test comes with a via chain that explains why it was picked:
ResourceManager.cs -> Dispose -> ConcurrentExecutorOn my own repository it looked fine. Depending on the file, it picked between 2 and 35 of the 46 tests, and the picks were right. It was also no faster: on a suite that small, building and starting the test host take most of the time, so a filtered run of 35 tests took 11.4 s against 10.4 s for everything. The selection worked. I just had no evidence it mattered, so on 23 September I pointed it at a real library.
What happened when DotNetDevMCP was pointed at Polly?
Polly is a good stress test. At the commit I used, it has 801 C# files and 7 test projects, each multi-targeted to net8.0, net9.0 and net10.0 (plus net481 on Windows). It runs xUnit v3 on Microsoft.Testing.Platform. The full suite is 12,262 test executions across all target frameworks, 3,065 on net10.0 alone.
I drove the server over stdio with a small scripted client, the way an agent calls it, and replayed Polly's last 40 commits. It broke six ways.
- Every test run failed. Polly's
global.jsonswitchesdotnet testto Microsoft.Testing.Platform, which takes different arguments from classic VSTest. I only supported VSTest. - The repo's
global.jsonwas ignored anyway. The server randotnetfrom its own working directory, not the project's, so the pinned SDK and test runner never applied. - Selection never finished. For one commit it ran for 70 minutes. In that time I cooked dinner, ate it, and came back to find it still searching, so I stopped it. Each target framework is a separate Roslyn project, so every symbol was searched once per framework, and the repeats compounded at every hop.
- Reference counts were inflated.
MaxRetryAttemptshas 79 matching lines in the repo. My tool reported 925 references: one per target framework, plus duplicates. - It missed
[MemberData]theories. When test data comes from a static field, the walk went from the field initializer to the static constructor, which nothing references, and stopped. - The default depth was too shallow. At 3 hops, the walk missed tests that reach the code through a chain of overloads, like
ExecuteAsync(action, ct)calling its way down to the implementation.
None of these showed up on my own repo. It has one target framework, no global.json quirks and no theories fed by fields.
How much faster is affected-test selection after the fixes?
Each fix went in with a number attached (the full method and raw data are in benchmarks/polly). Everything below ran on one laptop, an i7-10750H with 32 GB, so read it as a description of how the tool behaves. Your codebase will have its own numbers.
Small changes get much faster. A one-file change selected 5 test methods. On net10.0 they ran in 5.1 s, against 48.1 s for the full net10.0 suite in the same session. In a quieter session it was 4.6 s against 33.2 s.
Broad changes gain nothing, on purpose. Of the last 40 commits, 16 ran a filtered selection (median 82 test methods). The other 24 ran the full suite, either because the change reached core plumbing that everything depends on, or because the selection was big. That second rule came from a measurement: a 589-method selection ran slower filtered (40.5 s) than the whole suite (33.2 s). Filtered runs have per-project overhead, and past about 20% of the tests it stops paying off. So above that, the tool runs everything and says so.
It picks the tests that break. I injected a throwing statement into 10 random methods from files those commits touched, ran the full suite to see which tests actually failed, and compared that with the selection. Where the selection completed, it included 111 of the 112 failing tests, and every injected bug was caught by at least one selected test. The one miss builds its object through reflection, which static analysis can't see.
It never pretends. If the walk runs out of its time budget (10 s by default), the tool doesn't return the partial set it found. It falls back to running the test projects that depend on the changed code, or the whole solution, and the response says which and why.
There's a trade-off I kept in the defaults. Depth 3 narrows more commits (26 of 40 instead of 16) but missed about 10% of the tests a change breaks. A test selector has to be safe first, so the default is 8, and maxDepth: 3 is there if you want the speed.
Did warming up the Roslyn cache make selection faster?
The first selection of a session is slower, because Roslyn binds each file the first time a walk touches it. I added a background warm-up that built every project's compilation right after the solution loaded.
It made no measurable difference. Ninety seconds after loading, the first selection on a busy file still hit the budget. The cost is per document a specific walk touches, and warming the rest doesn't help. I removed it.
What did outside code reviews find?
After the benchmark, three outside reviews of the code came back. Between them, they found two problems I had not looked for.
- Argument injection. Tool arguments were concatenated into
dotnetandgitcommand lines. A crafted MSBuild property value could add-p:CustomBeforeMicrosoftCommonTargets=evil.targetsand import a targets file. Arguments are now passed as a list and validated, and list separators in property values are escaped. That was release 0.3.2. - Non-C# changes. A change to a
.csproj, a.razorfile orappsettings.jsonreturned "no changed .cs files" and ran nothing, even though those changes can break tests. They now run the test projects that depend on that project. That was 0.3.3.
One claim didn't hold up. A review said calls through an interface are missed. Roslyn's reference search follows interface and override chains, and there's now a test that proves it. Checking each claim against the code before changing anything was worth the time in both directions.
How was DotNetDevMCP itself built?
DotNetDevMCP was built with Claude Code, and the git log says so. The setup: one Claude session acted as lead and reviewer and handed pieces of the work to cheaper subagents (Haiku and Sonnet), each in its own git worktree. My job was the one step no agent was allowed to do, which was pressing Merge.
It was a real collaboration, so both sides made mistakes. I ran mcp-publisher publish before the version it pointed to existed on NuGet and got a polite HTTP 400 back. I found out my PowerShell doesn't accept && by pasting its error into the chat. I asked "where are we?" often enough that it became the status command.
The agents did no better. Two subagents searched my entire disk for one file and were still searching eight hours later, when they were stopped. A security subagent hit the monthly spend limit halfway through a fix, and the lead finished it by hand. The lead also overwrote my FUNDING.yml with a one-line version, which would have deleted my Buy Me a Coffee link, then read the diff and put the original back.
What made it work was a rule both of us followed: nothing changed until it was checked against the code or a measurement. That rule found the six Polly bugs, and it's also why one reviewer's claim was rejected instead of "fixed".
What are DotNetDevMCP's current limits?
- Reflection, string-keyed lookups and DI by convention are invisible. A test that reaches your code only that way won't be selected.
dryRun: trueshows what was picked and why. - No sandbox.
dotnet buildanddotnet testrun whatever the solution contains, with your permissions, just as they do in your terminal. For code you don't trust, run the agent and the server in a container.--clean-envkeeps secrets in environment variables away from child processes; the processes can still read your files and reach the network. - NuGet-only dependencies aren't followed. If a test project uses the changed library through a package reference instead of a project reference, the fallback won't find it.
- Broad changes cost the same as before. The win is on the small, frequent edits that make up most of an agent's loop.
How do I try DotNetDevMCP on my own solution?
claude mcp add dotnetdevmcp -- dotnet dnx DotNetDevMCP --yes- Code and issues: github.com/csa7mdm/DotNetDevMCP
- Package: nuget.org/packages/DotNetDevMCP
- Tutorial and tool reference: the wiki
- The benchmark, with scripts to reproduce it: benchmarks/polly
If you run it on your own solution, I'd like to hear what it picked and what it missed. The misses are how the six fixes above happened.